

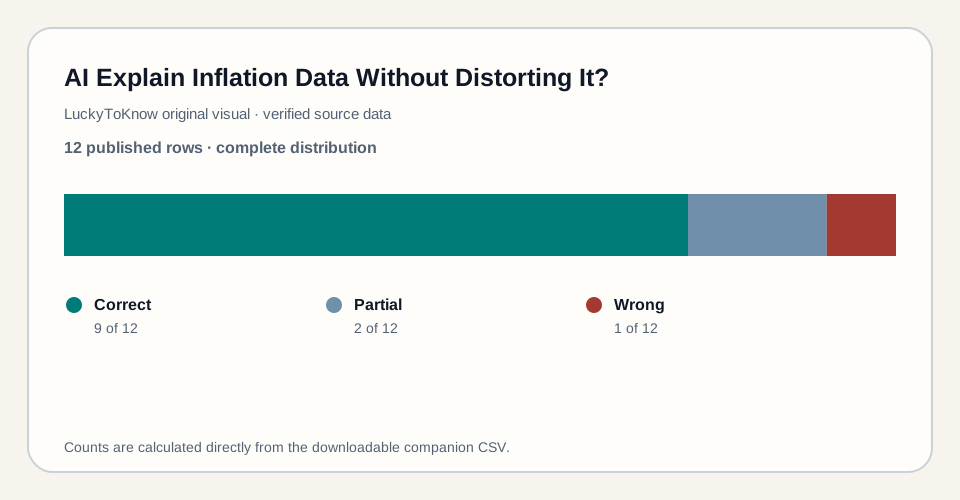
Answer in brief: Nine answers were correct, two were incomplete, and one made the common but material mistake of equating slower inflation with falling prices.
Can AI explain inflation without confusing a slower rate of increase with a fall in the price level? A useful answer has to be narrower than a product claim. This article tests a bounded workflow, publishes the scoring surface, and keeps consequential approval with a person. It does not turn a controlled result into personalized financial advice.
What we tested or analyzed
We asked OpenAI GPT-5.6 in a Codex editorial session 12 fixed questions using a small illustrative index series and checked definitions and calculations against BLS methodology. The example numbers are labeled synthetic.
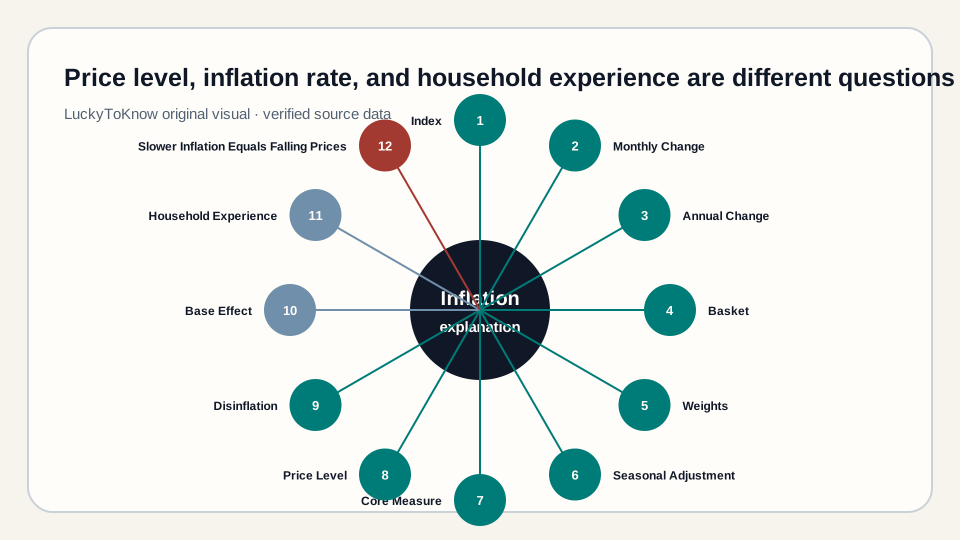
The original asset is a twelve-question inflation explanation benchmark. The complete machine-readable table is available as CSV. The evidence visual below summarizes the primary criterion; its values are also written in text and shown in the table, so the chart is not the only way to obtain the result.
The measured result
Nine answers were correct, two were incomplete, and one made the common but material mistake of equating slower inflation with falling prices.
The row-level outcome distribution was correct: 9, partial: 2, wrong: 1. Those labels are deliberately more descriptive than one blended score. A partial, review, stale, exception, or unsupported row can carry a different operational risk from a plainly wrong row, so the CSV preserves the reason beside the disposition.
| Item | Outcome | Evidence or note |
|---|---|---|
| IQ01 | correct | index |
| IQ02 | correct | monthly change |
| IQ03 | correct | annual change |
| IQ04 | correct | basket |
| IQ05 | correct | weights |
| IQ06 | correct | seasonal adjustment |
| IQ07 | correct | core measure |
| IQ08 | correct | price level |
| IQ09 | correct | disinflation |
| IQ10 | partial | base effect |
| IQ11 | partial | household experience |
| IQ12 | wrong | slower inflation equals falling prices |
Reading the evidence row by row
- IQ01 was recorded as correct. The evidence note is “index”; the disposition remains visible so it cannot be averaged away.
- IQ02 was recorded as correct. The evidence note is “monthly change”; the disposition remains visible so it cannot be averaged away.
- IQ03 was recorded as correct. The evidence note is “annual change”; the disposition remains visible so it cannot be averaged away.
- IQ04 was recorded as correct. The evidence note is “basket”; the disposition remains visible so it cannot be averaged away.
- IQ05 was recorded as correct. The evidence note is “weights”; the disposition remains visible so it cannot be averaged away.
- IQ06 was recorded as correct. The evidence note is “seasonal adjustment”; the disposition remains visible so it cannot be averaged away.
- IQ07 was recorded as correct. The evidence note is “core measure”; the disposition remains visible so it cannot be averaged away.
- IQ08 was recorded as correct. The evidence note is “price level”; the disposition remains visible so it cannot be averaged away.
- IQ09 was recorded as correct. The evidence note is “disinflation”; the disposition remains visible so it cannot be averaged away.
- IQ10 was recorded as partial. The evidence note is “base effect”; the disposition remains visible so it cannot be averaged away.
- IQ11 was recorded as partial. The evidence note is “household experience”; the disposition remains visible so it cannot be averaged away.
- IQ12 was recorded as wrong. The evidence note is “slower inflation equals falling prices”; the disposition remains visible so it cannot be averaged away.
The expected label or control was fixed before review. The visible note explains why the row received its disposition. The chart uses the published primary criterion, but the table is authoritative because it preserves exceptions that a single percentage would hide.
How to reproduce the check
- Download the CSV and read its labels, units, and synthetic/public-data notice before using it.
- Write the expected answers or decision rule before looking at a model response.
- Use the same bounded prompt and record the model or tool, access surface, and date.
- Preserve the raw response. Break prose into atomic claims rather than grading the tone of the whole answer.
- Recompute arithmetic with deterministic formulas and verify definitions against the linked primary sources.
- Record correct, partial, wrong, uncertain, and refused outcomes separately. Do not silently repair the model output before scoring it.
- Repeat material checks after a model, source, or workflow changes.
What the result means
The value of this result is diagnostic. It shows where a structured assistant can reduce search, formatting, or first-pass review work. It does not transfer responsibility for the underlying decision. A “pass” means the row met the published rule in this test, on this date, with these inputs.
The errors and open items matter more than a polished average. In money and business workflows, one missed assumption, stale fact, false match, or overconfident definition can dominate many correct low-risk rows. That is why the artifact keeps row-level outcomes and why a human reviews exceptions rather than receiving only a percentage.
Reproducibility also has limits. A reader can repeat the steps and inspect the same answer key, but a probabilistic model may not return identical wording. A useful rerun should therefore compare atomic claims, calculations, citations, and escalation decisions—not superficial phrasing.
Why this topic needs its own boundary
Economic evidence mixes measured history, model-based estimates, occupational exposure, projections, and policy judgment. These are not interchangeable. The analysis labels the unit, period, geography, method, and uncertainty before drawing an inference.
Aggregate evidence also describes distributions, not individual destiny. A national price index is not one household’s budget; occupational exposure is not a dismissal forecast; access to digital credit is not inclusion unless outcomes and exclusion risks are measured.
A safer operating workflow
- Link to the official series.
- Name the index and period.
- Separate level from rate of change.
- Explain base effects and revisions.
- Do not infer one household’s cost experience from an aggregate alone.
How each control changes the decision
Control 1: Link to the official series. For this test, that control answers the bounded question “Can AI explain inflation without confusing a slower rate of increase with a fall in the price level?” without extending the result into an untested decision.
Control 2: Name the index and period. For this test, that control answers the bounded question “Can AI explain inflation without confusing a slower rate of increase with a fall in the price level?” without extending the result into an untested decision.
Control 3: Separate level from rate of change. For this test, that control answers the bounded question “Can AI explain inflation without confusing a slower rate of increase with a fall in the price level?” without extending the result into an untested decision.
Control 4: Explain base effects and revisions. For this test, that control answers the bounded question “Can AI explain inflation without confusing a slower rate of increase with a fall in the price level?” without extending the result into an untested decision.
Control 5: Do not infer one household’s cost experience from an aggregate alone. For this test, that control answers the bounded question “Can AI explain inflation without confusing a slower rate of increase with a fall in the price level?” without extending the result into an untested decision.
Keep data collection, model preparation, deterministic validation, and approval as separate stages. Use the least sensitive input that can answer the question. If removing personal or confidential data makes the result ambiguous, route the case to an approved human process instead of restoring secrets to an unapproved tool.
Calculations need an independent formula; current facts need a current primary source; classifications need an “uncertain” route; and irreversible actions need explicit authorization outside the model. Logs should capture the version, prompt, source date, output, reviewer, correction, and final disposition without retaining unnecessary personal data.
Limitations and professional boundary
The calculation example is synthetic. Official country measures, baskets, weights, and publication practices differ.
This publication provides general educational information. It does not know a reader’s finances, duties, jurisdiction, contracts, tax treatment, credit position, or risk tolerance. A qualified financial, accounting, tax, legal, lending, security, or other professional should review decisions with material consequences.
Primary sources
Verified 2026-07-26. Primary-source links can change; use the publication date and linked source to check for a newer version.
Bottom line
Nine answers were correct, two were incomplete, and one made the common but material mistake of equating slower inflation with falling prices. The practical lesson is to make AI produce inspectable work inside a controlled process—not to make fluency the final control.